Here I state each type of data that I wish to collect using my custom circuit of sensors. I also include brief comments about each sensor’s physical technology. I do not list the sensors on board the balloon kit’s included, off-the-shelf components, which are integrated into the Eagle Flight Computer and the SpotTrace satellite tracker.
The devices that I will use to collect data are mostly MEMS (micro-electromechanical) chips. I have found that there is a lot of ingenuity packed into very low-priced chips with this technology.
- Earth’s magnetic field, 3-axis, measured by the NXP FX0S8700 chip:
- Hall-effect sensor: a current is applied through a rectangular, conducting wafer, and the voltages across each spatial dimension of the wafer change in response to intersection of the wafer with magnetic fields, such as the microteslas magnetic field produced by the planet.
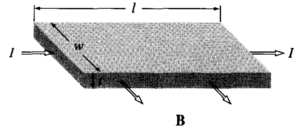
- Figure 5.56 from Dr. David Griffith’s Introduction to Electrodynamics, 3rd edition, 1999, page 247, problem 5.39
- I = applied current; L, w, t = spatial dimensions of the wafer; B = Earth’s magnetic field
- Voltages are measured beween opposite surfaces, across each dimension : there are six faces to the wafer, and voltage is measured between each pair of opposite faces for a total of three spatial dimensions.
- Hall-effect sensor: a current is applied through a rectangular, conducting wafer, and the voltages across each spatial dimension of the wafer change in response to intersection of the wafer with magnetic fields, such as the microteslas magnetic field produced by the planet.
- Acceleration, 3-axis, measured by the NXP FX0S8700 chip:
-
- For each axis, there is a capacitor in the chip, with the parallel plates arranged orthogonally to the desired axis of measurement (Varanis et al, 2018)
- Each capacitor is composed of gaseous dielectric separating two electrodes;
- One of the electrodes is massive of known mass, meant to respond quantifiably to acceleration along the relevant axis
- Changes in capacitance in each axis are interpreted as changes in acceleration.
-
- Rotation, measured by the gyroscopic NXP FXAS21002 chip:
-
- A MEMS gyroscopes contains a mass vibrating along one axis, with capacitive sensors to measure any apparent force along an orthogonal axis. (Passaro et al, 2017)
- The FXAS21002 chip uses one vibrating mass to sense rotation around two axes, and a second vibrating mass to cover the third axis.
- The apparent motion orthogonal to the vibration is known as the Coriolis force, the same apparent force that causes east-west deflection of north-south winds on a rotating planet.
- Although neither NXP nor Passaro divulge any strategy to obtain the necessary vibrating mass on a chip, I assume that this is just another use for piezoelectric material, such as lead zirconate titanate, which vibrates at an ultrasonic rate when subjected to an oscillating electric field.
-
- Temperature, measured by the Asair AHT20 chip:
-
- Although temperature is also measured on two other chips on board, I expect the temperature to drop below 0 C in the stratosphere, and this AHT20 chip is the only temperature sensor on board that is rated for -40 C work.
- Temperature-sensing chips usually use a bipolar junction transistor (BJT) whose base and emitter terminals are biased with a small current.
- Details are not given on the Asair AHT20 datasheet, so I used the datasheet from a similar product by Sensirion to learn these details.
- The voltage between the emitter and the base is quantifiably temperature-dependent, linear under the temperatures of normal operation, such as 0 C to 100 C.
- A larger current is applied from the collector to the emitter, and this current is modulated by the temperature-dependent base-emitter voltage.
- The larger, collector-emitter current is proportional to the minimal, base-emitter current (Chenming & Hu, 2009, pp. 291-293), and therefore proportional to temperature.
- The base-emitter current is modulated by temperature because the voltage and the current are related by Ohm’s Law (Griffiths 1999, p. 287).
-
- Humidity, measured by measured by the Asair AHT20 chip
-
- Such a device usually uses a capacitor sharing the chip with the BJT thermometer
- The capacitor is made of multiple electrodes arranged like stepping-stones underneath a common, polymer dielectric layer (“sensor polymer“):
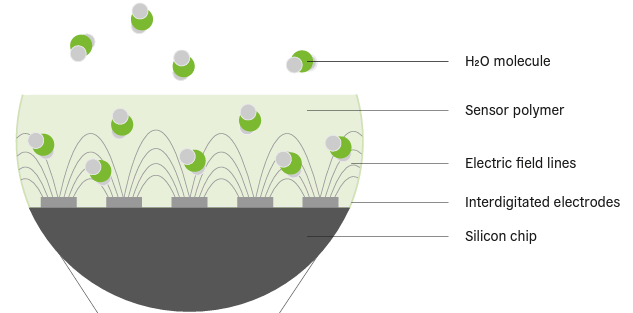
- Capacitance decreases when the dielectric absorbs water molecules from the ambient air because of high polarity of water molecules
- Water molecules, being very polar, would reduce the dielectric constant of the “sensor polymer” upon absorption, as explained by Griffiths, 1999, pages 196-197.
- Capacitance increases when the dielectric releases water molecules back into the ambient air, which occurs when ambient relative humidity decreases.
-
- Carbon dioxide (ppm, via infrared absorption, corrected for humidity), measured by the Sensirion SCD-30 chip
- Humidity correction is necessary because water also absorbs infrared in the region that carbon dioxide absorbs
- Carbon dioxide absorbs at 4.26 microns, due to bond vibrations.
- An infrared LED element on the chip and infrared photodiodes are typically used in NDIR CO2 sensor chips (Jia et al, 2021).
- The Sensirion SCD-30 chip is categorized as a non-dispersive IR sensor (NDIR) because it directly produces the necessary wavelength of light, without the need to select the appropriate wavelength from a spectrum produced by a diffraction grating in front of a generalized light source (info from ThermoFisher).
- Volatile organic compounds, measured by the Bosch BME680 chip
- tin (IV) oxide inside this chip is heated to about 300 C
- The heated SnO2 adsorbs oxygen molecules onto its surface
- Oxygen being more electronegative than tin, the oxygen molecules take the highest-energy electrons from the tin, which are the conduction-band electrons
- In spite of being an oxide, SnO2 is conductive and in fact is also transparent (this was a surprise to me.)
- Tin(IV) ions having complete d-shells are electron-rich and seem to donate conduction-band electrons into the pi-antibonding orbital of molecular oxygen O2 at temperatures > 150 C , breaking the double bond and forming a pair of atomic oxygen anions, O- and O– (this is a larger surprise to me, from section 4, “Basic Science Understanding of SnO2 Sensors” from the linked text by Barsan et al.; the illustration below, however, is from another source, a 2012 International Meeting on Chemical Sensors🙂
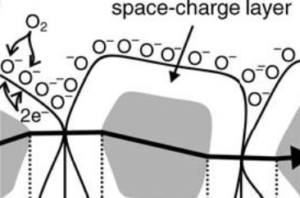
- The atomic oxygen ions oxidize any organic molecules that pass by the surface (and the surface is nanoporous to encourage this)
- The oxidation reaction causes a loss of electrons from the SnO2 surface, with a measurable increase in the bulk resistance.
- Temperature, pressure and humidity are also collected on the same chip because these parameters affect the measured response of SnO2; compensation must be done (by me, somehow) after data collection.
- A Bosch API for the compensation calculations is cited by the Bosch datasheet, but I am not sure how to learn to use an API.
- Example: humidity will increase the conductivity of the SnO2 surface, although according to Barsan et al. there are three, different hypotheses to explain this.
- Air pressure, measured by the Bosch BME680 chip
- Air pressure can be measured by changes in capacitance as a dielectric gap between two metal oxide conductors shrinks in high pressure and expands in low pressure. I assume that the dielectric should be a sealed gas, for the highest compressibility and therefore highest resolution in pressure sensing. This info and the figure below are from Rao et al., 2014:

- Particulate matter (PM2.5 by Mie light scattering, device PMSA003i)
- Mie scattering is the name given to the scattering of photons by particles of diameter near the photons’ wavelength .
- Mie scattering on PM2.5 particles uses infrared photos, of wavelengths in microns.
- The PM2.5 sensor includes an active fan for ambient sampling
- Ionizing radiation (counts per minute, from a miniature Geiger-Muller tube assembly)
- This sensor does not come with a convenient code library, so I might not be able to use it after all.
- Visible light imagery (pair of GoPro Session cameras)
- No code library needed; the cameras have their own SD memory cards.
And now, further comments on the first data collection item, the geomagnetic field sensing, follow.
Four years ago (2019), an Israeli group published a balloon launch similar to mine (max altitude 28 km), with a magnetometer on board. Their magnetometer was much more sensitive, however. Instead of using the Hall effect, they used a fluxgate, consisting of a ring of ferromagnetic material wrapped in a coil of copper wire; changes in the magnetic flux through the core induced current in the coil for detection.
But I have tested a cheap Hall effect sensor similar to the one on my payload, and it is sufficiently sensitive to measure microtesla-scale changes in ambient magnetic field. I believe that my results will be similar to the Israeli group’s results, except I may have a lot more noise.
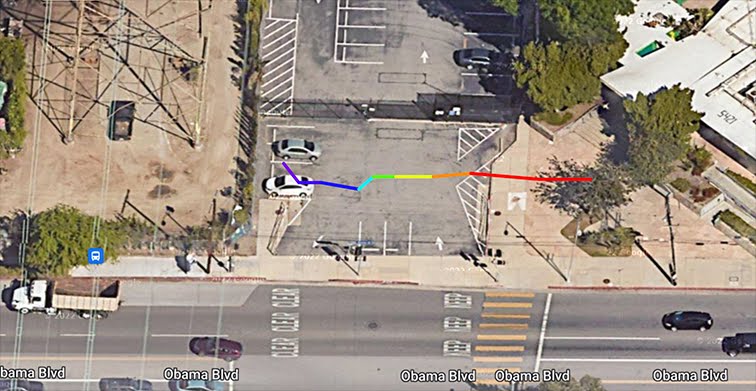
The way I tested the Hall effect sensor before launching was this: my teammates at my workplace took the Hall effect sensor to a nearby high-voltage pylon, and measured the ambient magnetic field at different distances from the base of the pylon, traveling on foot. The results showed a distance-dependent decline in magnetic field strength just within a few meters of the base of the pylon, until the magnetic field leveled out at around 40 microtesla, which is reasonable for the geomagnetic field. These measurements are shown below. Each measurement was taken while connected to several GPS satellites, so we imported the GPS coordinates to Google Maps for an overlay of each measurement’s location. There are eleven measurements, and the distance between each measurement is shown qualitatively by a different color on the Google Map Satellite View.

The Israeli group’s high-altitude magnetometry yielded the following confusing figure:
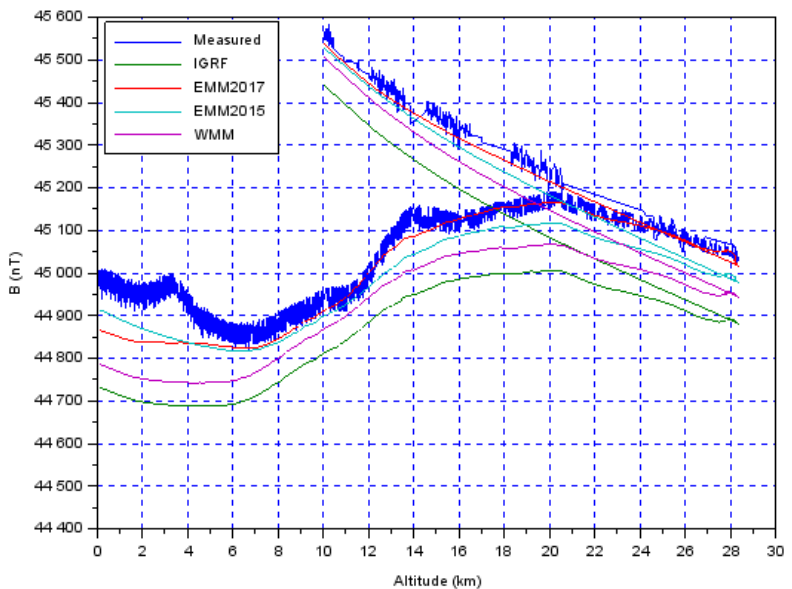
The figure is confusing because between 10 km and 21 km of altitude, there are two magnetic field measurements without explanation in the text of the article. The blue curve is the measured magnetic field by the balloon payload; the other lines are different mathematical models developed from ground-based and orbital measurements. I considered the possibility that between 10 km and 21 km there was divergent magnetometry on the descent compared to the ascent, but this possibility can be eliminated because the mathematical modeling also shows the strange dual-magnetometry between 10 km and 21 km. The article was a conference brief, rather than a peer-reviewed journal work, so it is possible that the graph just had some extra data by mistake, between 10 km and 21 km. I expect that my results will be:
- noisier, since I measuring the magnetic field via the Hall effect, which is a less direct technique than the induction method used by the Israeli group
- less confusing, since I expect my measurements to be a one-to-one correspondance between magnetic field strength and altitude for the entire range of altitude.